When I saw that Post CH were going to issue a range of Tolkien themed stamps with illustrations by John Howe it wasn’t much of a quandary as to whether I’d buy a set or not 😉 they arrived this morning and they do look good.
Read MoreStamping

Everything else…
When I saw that Post CH were going to issue a range of Tolkien themed stamps with illustrations by John Howe it wasn’t much of a quandary as to whether I’d buy a set or not 😉 they arrived this morning and they do look good.
Read More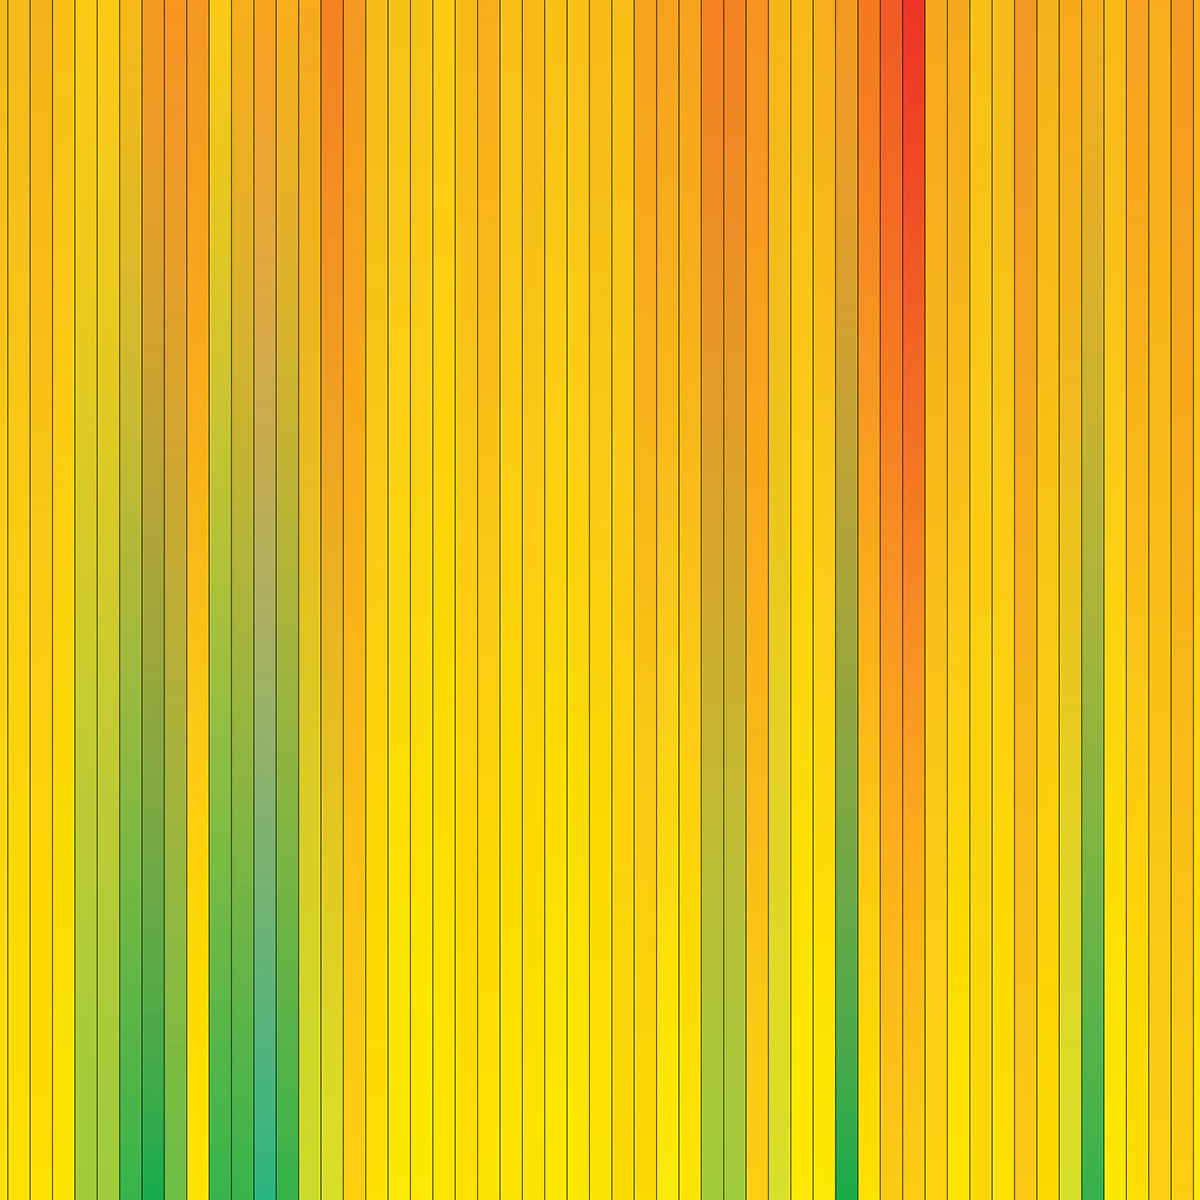
Being a bit nerdy at times I decided to make a colour graph of the temperature recordings we’d taken over the year, for each day the colour graduates between the maximum and minimum temperature recorded, the barometric reading for the days has been overlayed. As it’s a bit small to view on this webpage I put a larger version here, there’s also one with rain and wind speeds on here.
Read More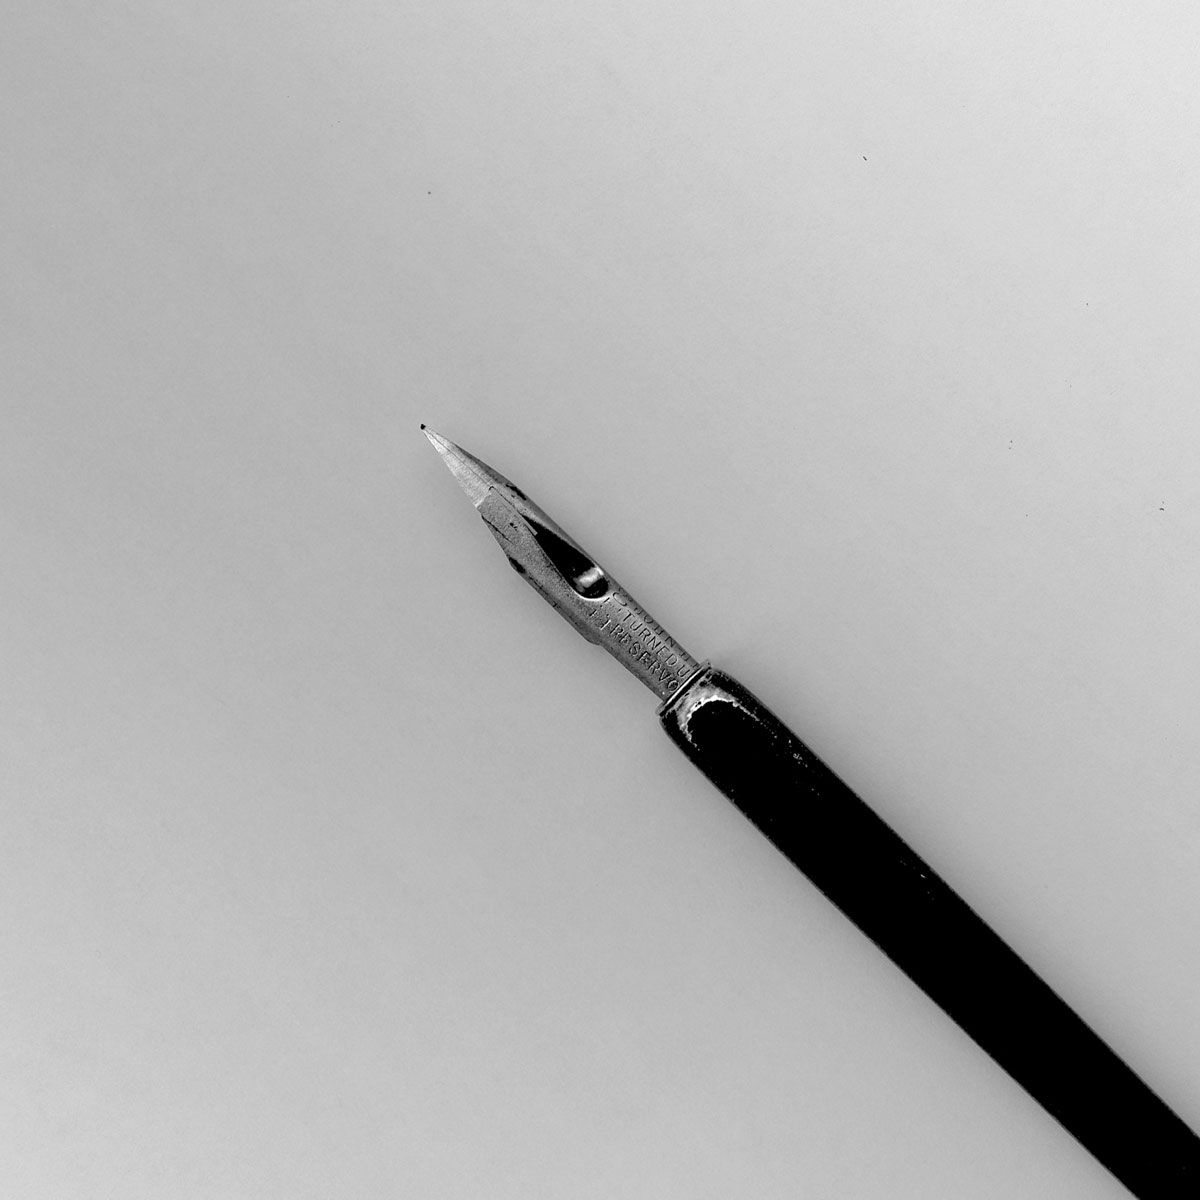
I didn’t intend to take part in inktober this year, or at least I didn’t plan on it, but it was fun to do in the end….
Read More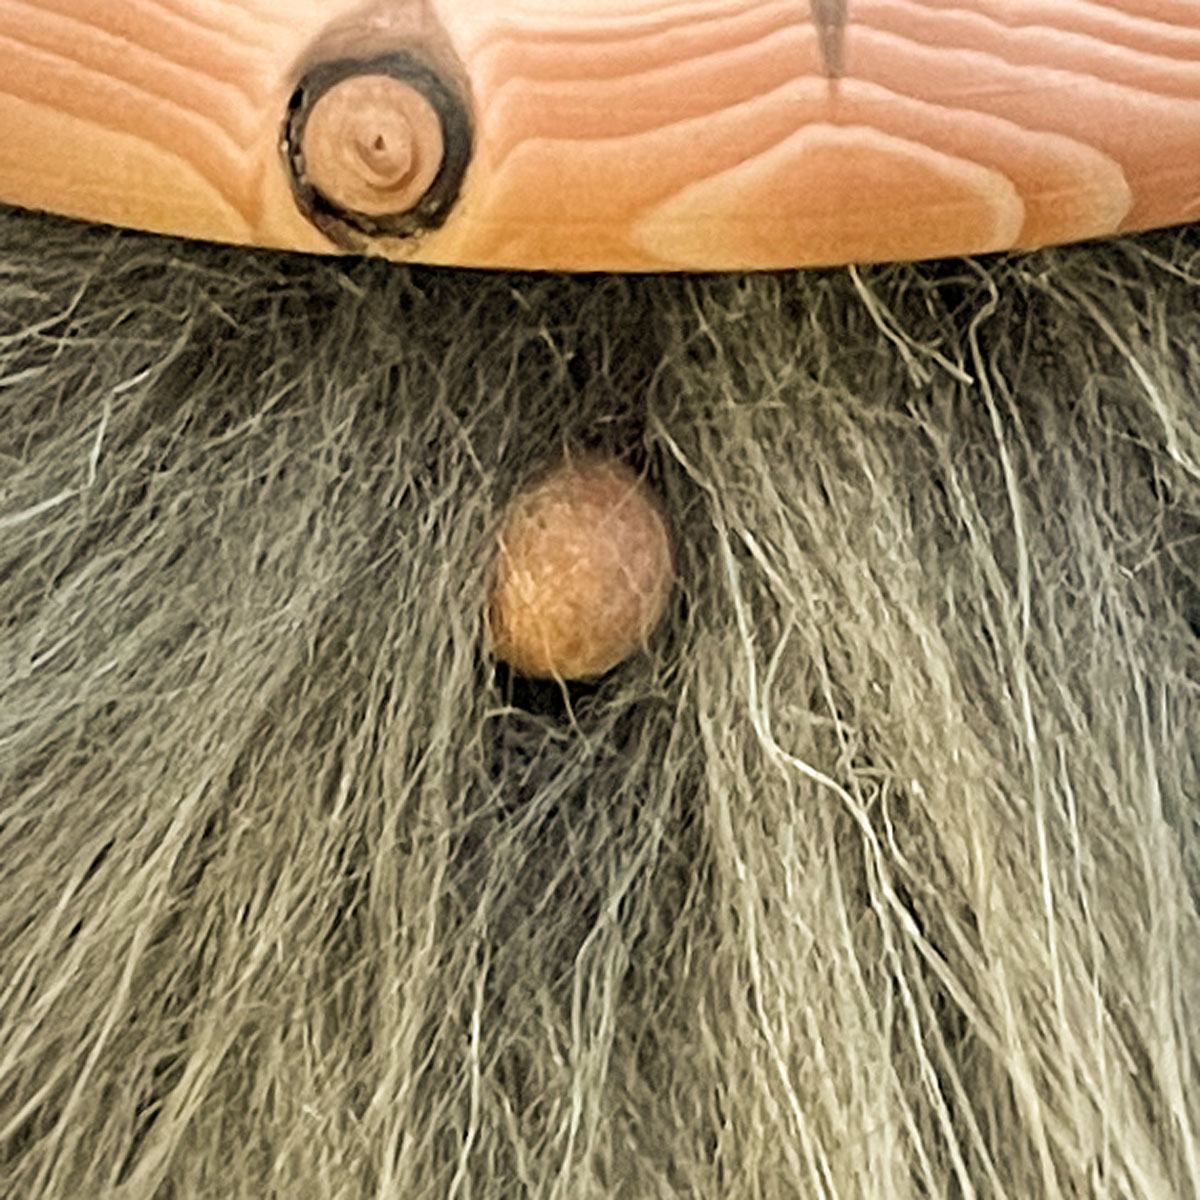
A little woodturning project to distract me for an afternoon 😉 The hat is turned from Yew, the body Beech, and the nose and tip of the hat Cherry.
Read More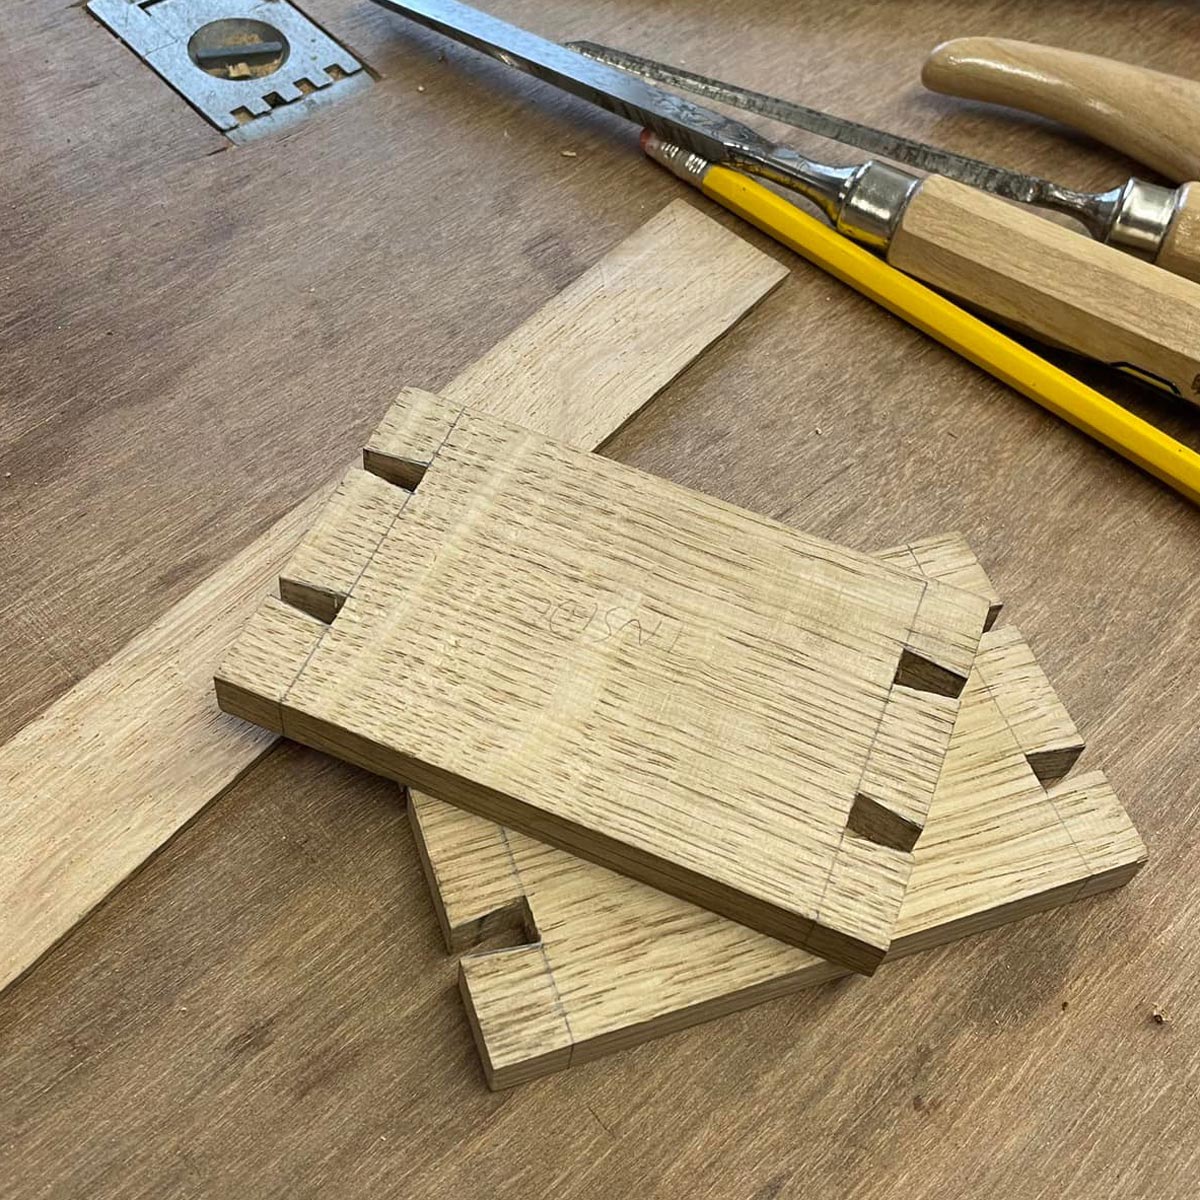
I decided to try and make an oak box without any metal fixings, well, why not 😉 made a few mistakes along the way and there’s still some fettling to do but I’m happy with the result so far. The wood hinges were interesting to make, and I’d probably do them differently next time.
Read More